Use Collection Services to collect performance data for later analysis by the Performance Tools for iSeries™ licensed program or other performance report applications, iSeries Navigator monitors, and the graph history function. (If you prefer viewing real-time performance data, system monitors provide an easy-to-use graphical interface for monitoring system performance.)
Collection Services collects data that identifies the relative amount of system resource used by different areas of your system. Use Collection Services to:
- Easily manage your collection objects
- Collect performance data continuously and automatically with minimal system overhead
- Control what data is collected and how the data is used
- Move performance data between releases without converting the data
- Create performance data files that are used by Performance Tools
- Integrate your own programs to collect user-defined performance data into Collection Services.
How Collection Services works
Collection Services replaces the i5/OS™ performance monitor, which was called by the Start Performance Monitor (STRPFRMON) command. The Performance Monitor (STRPFRMON command) has not been available since V4R5. When you used the i5/OS performance monitor, your data was collected into as many as 30 database files.
Collection Services capabilities introduce a new process of collecting performance data. Collection Services stores your data for each collection in a single collection object, from which you can create as many different sets of database files as you need. This means a lower system overhead when collecting performance data. Even if you elect to create the database files during collection, you still experience a performance advantage over the i5/OS performance monitor because Collection Services uses a lower priority (50) batch job to update these files. The reduction in collection overhead makes it practical to collect performance data in greater detail and at shorter intervals on a continuous basis. Collection Services enables you to establish a network-wide system policy for collecting and retaining performance data and to implement that policy automatically. For as long as you retain the management collection objects, if the need arises, you have the capability to look back and analyze performance-related events down to the level of detail that you collected.

Collection Services allows you to gather performance data with little or no observable impact on system performance. You can use iSeries Navigator to configure Collection Services to collect the data you want as frequently as you want to gather it. A collection object, *MGTCOL, serves as an efficient storage medium to hold large quantities of performance data. Once you have configured and started Collection Services, performance data is continuously collected. When you need to work with performance data, you can copy the data you need into a set of performance database files.
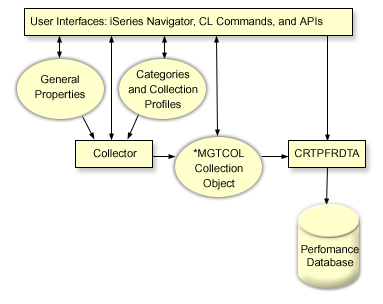
The figure above provides an overview of the following Collection Services elements:
- User interfaces
- Several methods exist that allow you to access the different elements of Collection Services. For example, you can use CL commands, APIs, and theiSeries Navigator interface.
- General properties
- General properties define how a collection should be accomplished and they control automatic collection attributes.
- Data categories
- Data categories identify the types of data to collect. You can configure categories independently to control what data is collected and how often the data is collected.
- Collection profiles
- Collection profiles provide a means to save and activate a particular category configuration.
- Performance collector
- The performance collector uses the general properties and category information to control the collection of performance data. You can start and stop the performance collector, or configure it to run automatically.
- Collection Object
- The collection object, *MGTCOL, serves as an efficient storage medium for large quantities of performance data.
- Create Performance Data (CRTPRFDTA) command
- The CRTPFRDTA command processes data that is stored in the management collection object and generates the performance database files.
- Performance database
- The database files store the data that is processed by the CRTPFRDTA command. The files can be divided into these categories: Performance data files that contain time interval data, configuration data files, trace data files.
For an illustration of how Collection Services and system and job monitors work together on the system, refer to System and Job monitor interaction with Collection Services.
How to start Collection Services
You can start Collection Services by using any of the following methods. However, the information in the Performance topic focuses on iSeries Navigator methods.
| Starting method | Description |
|---|---|
| Start Performance Collection (STRPFRCOL) command | Use the STRPFRCOL command to start the system-level collection of performance data by Collection Services. |
| iSeries Navigator | Perform a variety of Collection Services tasks by using iSeries Navigator. The table that follows below lists these tasks and links you to information about how to complete them. |
| Performance Management APIs | Use Performance Management APIs to start, customize, end, and cycle collections. In addition, you can use the APIs to work with the management collection objects or define your own transactions. |
| Traditional menu options | Type GO PERFORM in the character-based interface and select option 2 (Collect performance data) from the Performance Tools main menu. For additional information, go to the Performance Tools book. |
| PM iSeries | PM iSeries automates the start of Collection Services and then creates the database files during collection. |
