Performance explorer works by collecting detailed information about a specified system process or resource. This topic explains how performance explorer works, and how best to use it.
Performance explorer has advantages for people who need detailed performance analysis on an iSeries™ server. Using performance explorer you can:
- Determine what is causing a performance problem on the system down to the level of user, job, file, object, thread, task, program, module, procedure, statement, or instruction address.
- Collect performance information on user-developed and system software.
- Do a detailed analysis on one job without affecting the performance of other operations on the system.
- Analyze data on a system other than the one on which it was collected. For example, if you collect data on a managed system in your network, you can send it to the central site system for analysis.
Like Collection Services, performance explorer collects data for later analysis. However, they collect very different types of data. Collection Services collects a broad range of system data at regularly schedules intervals, with minimal system resource consumption. In contrast, performance explorer starts a session that collects trace-level data. This trace generates a large amount of detailed information about the resources consumed by an application, job, or thread. Specifically, you can use Performance Explorer to answer specific questions about areas like system-generated disk I/O, procedure calls, Java™ method calls, page faults, and other trace events. It is the ability to collect very specific and very detailed information that makes the performance explorer effective in helping isolate performance problems. For example, Collection Services can tell you that disk storage space is rapidly being consumed. You can use performance explorer to identify what programs and objects are consuming too much disk space, and why.
 When performance explorer is running, it creates only the files
that are needed for the collection.
How performance explorer works
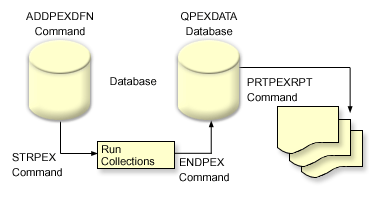
The following figure should help you become familiar with the normal path through the performance explorer. For details on each of these steps, see Configure performance explorer. The figure shows a basic work cycle that consists of the following steps:
- Define a performance explorer data collection. You can also add a filter to limit the amount of data collected by specifying a compare value for specific events.
- Start the performance explorer to collect the data based on your definition.
- Run your program, command, or workload.
- End the collection, which saves the collected data to a set of database files.
- Create and print reports from the database files.

To learn more about performance explorer, refer to any of the following performance explorer topics.