Collection services is both a valuable tool for performance analysis as a stand alone application and as a utility used by other applications for the collection of performance data.
Sometimes, performance analysis causes confusion when trying to determine which application is responsible for activity you may see on your system. One easy rule to remember for this issue is that even if it looks like those other applications are busy, there is one and only one data collection occurring on the system at any given time.
The following scenarios explain the different combinations between system monitors and job monitors and Collection Services and what Collection Services displays.
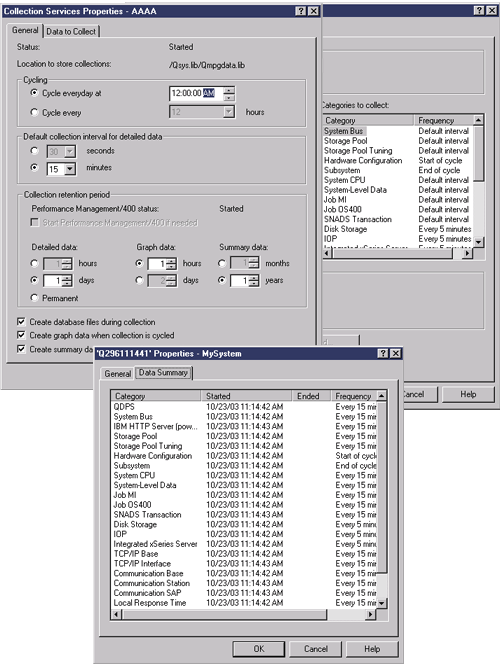
Collection Services is collecting data using the default values
In this scenario, there are no system monitors or job monitors active on the system. When viewing the Collection Services properties page and the *MGTCOL object properties view, you see something similar to the following:

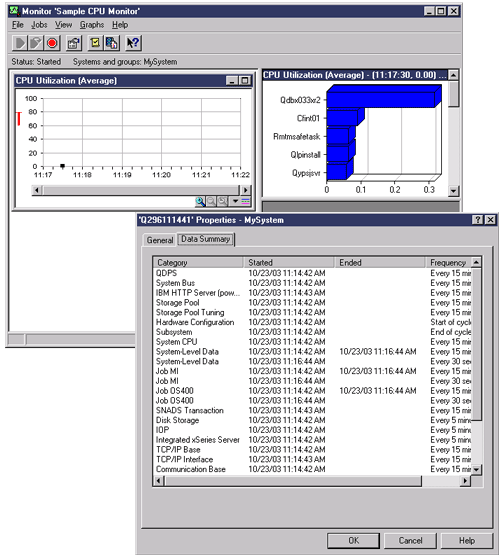
Both Collection Services and a system monitor are started
This scenario shows that Collection Services had already started at some point, and later someone started a system monitor to collect CPU Utilization (Average) metric data at 30-second intervals. Notice in the *MGTCOL object properties view that the collection interval for System Level Data, Job MI Data, and Job OS Data categories changed from 15 minutes to 30 seconds. This demonstrates that the same *MGTCOL object is being used, and only those categories necessary to calculate information for a given metric were changed to collect at the new interval.

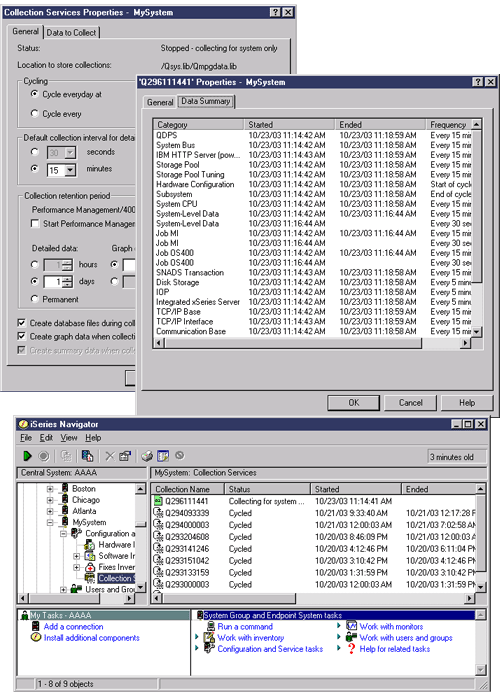
Collection Services stopped and system monitor remains started
In this scenario, Collection Services was stopped and the system monitor remains started and continues to collect data necessary to calculate the graph metrics.
Observe the following:
- The Collection Services properties page shows a status of System collection stopped. Collecting for applications only.
- The *MGTCOL object properties page shows that data collection has ended for all categories except for those necessary to calculate the graph metric data.
- The Collection Services list view shows the *MGTCOL object with a status of Collecting.... This might be confusing; therefore, to get the status of Collection Services, look at the Collection Services Properties page.
