The Plan Cache contains a wealth of information about the SQE queries being run through the database. Its contents are viewable through the iSeries Navigator GUI interface.
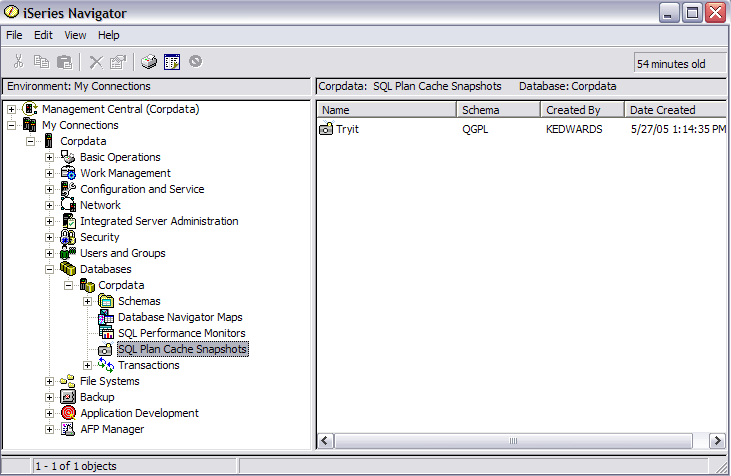
This Plan Cache interface provides a window into the database query operations on the system. The interface to the Plan Cache resides under the .

Clicking the SQL Plan Cache folder shows a list of any snapshots gathered so far. A snapshot is a database monitor file generated from the plan cache and can be treated very much the same as the SQL Performance Monitors list. The same analysis capability exists for snapshots as exists for traditional SQL performance monitors.
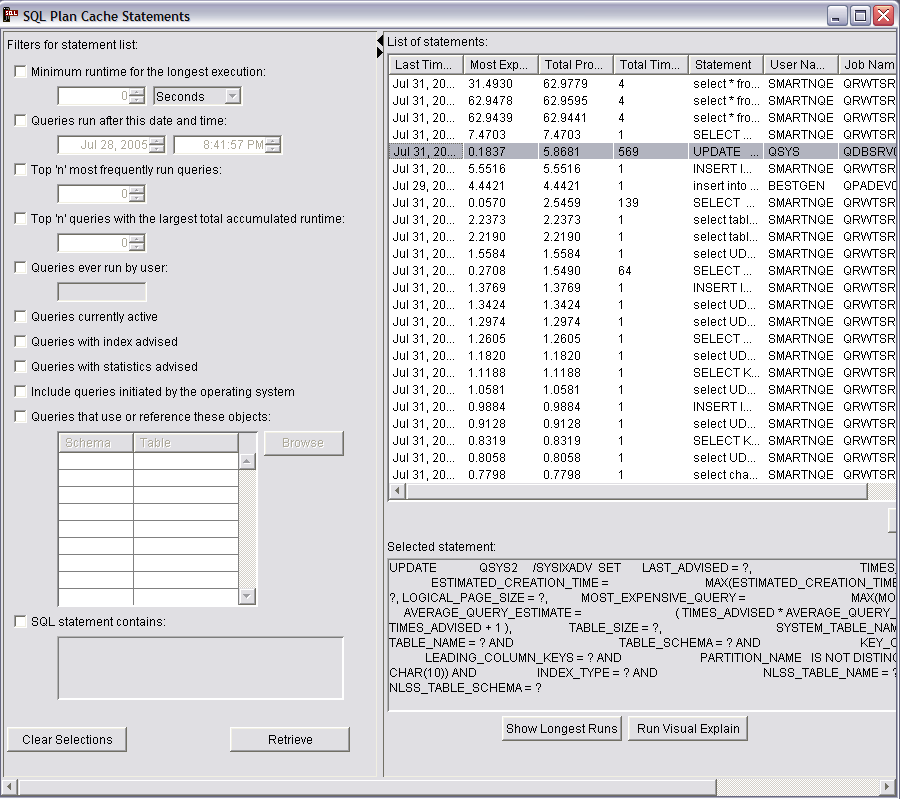
By right-clicking the SQL Plan Cache icon, a series of options are shown which allow different views of current plan cache of the database. The option brings up a screen with filtering capability. This screen provides a direct view of the current plan cache on the system.

Note that the retrieve action needs to be performed (pushed) to fill the display. The information shown shows the SQL query text, the last time the query was run, the most expensive single instance run of the query, total processing time consumed by the query, total number of times the query has been run and information about the user and job that first created the plan entry. It also shows how many times (if any) that the database engine was able to reuse the results of a prior run of the query to avoid rerunning the entire query.
The screen also provides filtering options which allow the user to more quickly isolate specific criteria of interest. No filters are required to be specified (the default), though adding filtering will shorten the time it takes to show the results. The list of queries that is returned is ordered by default so that those consuming the most processing time are shown at the top. You can reorder the results by clicking on the column heading for which you want the list ordered. Repeated clicking toggles the order from ascending to descending. When an individual entry is chosen, more detailed information about that entry can be seen. Show Longest Runs shows details of up to ten of the longest running instances of that query. Run Visual Explain can also be performed against the chosen query to show the details of the query plan. Finally, if one or more entries are highlighted, a snapshot (database performance monitor file) for those selected entries can be generated.
The information presented can be used in multiple ways to help with performance tuning. For example, Visual Explain of key queries can be utilized to show advice for creating an index to improve those queries. Alternatively, the longest running information can be used to determine if the query is being run during a heavy utilization period and can potentially be rescheduled to a more opportune time.
One item to note is that the user and job name information given for each entry is the user and job that initially caused the creation of the cached entry (the user where full optimization took place). This is not necessarily the same as the last user to run that query.
The filtering options provide a way to focus in on a particular area of interest:
- Minimum runtime for the longest execution
- Filter to those queries with at least one long individual query instance runtime
- Queries run after this date and time
- Filters to those queries that have been run recently
- Top 'n' most frequently run queries
- Finds those queries run most often.
- Top 'n' queries with the largest total accumulated runtime
- Shows the top resource consumers. This equates to the first n entries shown by default when no filtering is given. Specifying a value for n improves the performance of getting the first screen of entries, though the total entries displayed is limited to n.
- Queries ever run by user
- Provides a way to see the list of queries a particular user has run. Note that if this filter is specified, the user and job name information shown in the resulting entries still reflect the originator of the cached entry, which is not necessarily the same as the user specified on the filter.
- Queries currently active
- Shows the list of cached entries associated with queries that are still
running or are in pseudo close mode. As with the user filtering, the user
and job name information shown in the resulting entries still reflects the
originator of the cached entry, which is not necessarily the same as the user
currently running the query (there may be multiple users running the query). Note: Current SQL for a job (right-click the Database icon) is an alternative for the viewing a particular job's active query.
- Queries with index advised
- Limits the list to those queries where an index was advised by the optimizer to improve performance.
- Queries with statistics advised
- Limits the list to those queries where a statistic not yet gathered might have been useful to the optimizer if it was collected. The optimizer automatically gathers these statistics in the background, so this option is normally not that interesting unless, for whatever reason, you want to control the statistics gathering yourself.
- Include queries initiated by the operating system
- includes into the list the 'hidden' queries initiated by the database itself behind the scenes to process a request. By default the list only includes user initiated queries.
- Queries that use or reference these objects
- Provides a way to limit the entries to those that referenced or use the table(s) or index(s) specified.
- SQL statement contains
- Provides a wildcard search capability on the SQL text itself. It is useful for finding particular types of queries. For example, queries with a FETCH FIRST clause can be found by specifying ‘fetch’. The search is case insensitive for ease of use. For example, the string 'FETCH' will find the same entries as the search string 'fetch'.
Multiple filter options can be specified. Note that in a multi-filter case, the candidate entries for each filter are computed independently and only those entries that are present in all the candidate lists are shown. So, for example, if you specified options Top 'n' most frequently run queries and Queries ever run by user, you will be shown those most-run entries in the cache that happen to have been run at some point by the specified user. You will not necessarily be shown the most frequently run queries run by the user (unless those queries also happen to be the most frequently run queries in the entire cache).
The option shows high level information about the cache, including for example, cache size, number of plans, number of full open and pseudo opens that have occurred.

This information can be used to view overall database activity. If tracked over time, it provides trends to help you better understand the database utilization peaks and valleys throughout the day and week.
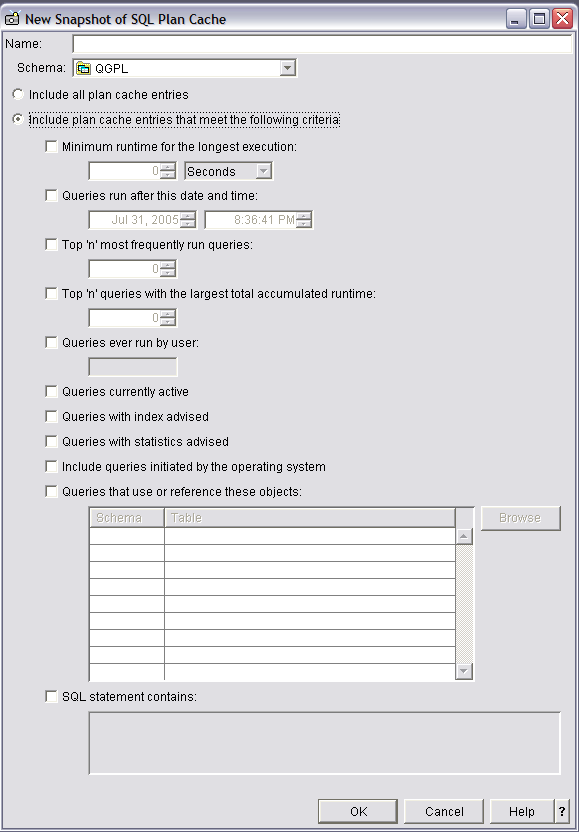
The option allows for the creation of a snapshot from the plan cache. Unlike the snapshot option under Show Statements, it allows you to create a snapshot without having to first view the queries.

The same filtering options are provided here as on the Show Statements screen.
The stored procedure, qsys2.dump_plan_cache, provides the simplest way to create a database monitor file output (snapshot) from the plan cache. The dump_plan_cache procedure takes two parameters, library name and file name, for identifying the resulting database monitor file. If the file does not exist, it is created. For example, to dump the plan cache to a database performance monitor file in library QGPL:
CALL qsys2.dump_plan_cache('QGPL','SNAPSHOT1');
Note that the plan cache is an actively changing cache. Therefore, it is important to realize that it contains timely information. If information over long periods of time is of interest, consider implementing a method of performing periodic snapshots of the plan cache to capture trends and heavy usage periods. The APIs described above, used in conjunction with job scheduling (for example), can be used to programmatically perform periodic snapshots.

