This scenario discusses how to monitor Web server activity with logs.
 for more information.
 Scenario
The JKL Toy Company (a fictitious company) wants to know who is visiting their Web site. The JKLTEST server is already using a combined access log, but the JKL Web administrator wants to create a new access log that can be altered without affecting the data in the default access log file. By using this method, the JKL Web administrator will have two logs that can be formatted to log specific information.
The JKL Web administrator found that enabling the logging function has some advantages and some disadvantages. Enabling the logging function does cause a small performance hit on the server, but a wide range of information about who is visiting the Web site can be obtained. After reading the information on log formats, the JKL Web administrator has decided to use the Combined, or NCSA Extended, log format.
See Module mod_log_config for HTTP Server (powered by Apache) for advanced information.
Prerequisites
- It is assumed you have read Scenarios for HTTP Server.
- It is assumed you have read and completed JKL Toy Company creates an HTTP Server (powered by Apache) or you have an existing HTTP Server (powered by Apache) configuration.
Start the IBM® Web Administration for i5/OS™ interface
- Start a Web browser.
- Enter http://[iSeries_hostname]:2001 in the location or URL field
.
Example: http://jkl_server:2001
Note: If you have changed your port number for the IBM Web Administration for i5/OS interface, replace port 2001 with your port number. - Click IBM HTTP Server for iSeries.
Set up a log file
- Click the Manage tab.
- Click the HTTP Servers subtab.
- Select your HTTP Server (powered by Apache) instance from the Server list.
Example: JKLTEST
- Select Global configuration from the Server area list.
- Expand Server Properties.
- Click Logging.
- Click the Custom Logs tab in the form.
- Click Add under the Custom logs table.
- Enter a name for the new log in the Log column.
Example: logs/server_monitor
Note: The above example creates a log file named server_monitor in the /logs directory. - Select combined from the Log format list in the Attributes column.
- Optional: Accept the default Environment variable condition or enter a new value.
- Optional: Accept the default expiration of the log or enter a new value.
- Optional: Accept the default maximum cumulative seize or enter a new value.
- Click Continue.
- Optional: Click Log identity of client. This may significantly
degrade performance of the web server. under Client identity logging.Note: The option to Log identity of client will impact server performance by requiring a Domain Name Server (DNS) lookup every time a new client is logged. If you do not log the identity of the client the IP address of the client will be logged instead of the domain name. Some log analysis tools can perform DNS lookup, allowing identity of clients without impacting your performance.
- Click OK.
Restart your HTTP Server (powered by Apache)
Select one of the following methods below:
Manage one server
- Click the Manage tab.
- Click the HTTP Servers subtab.
- Select your HTTP Server from the Server list.
- Click the Stop icon if the server is running.
- Click the Start icon.
Manage all servers
- Click the Manage tab.
- Click the HTTP Servers subtab.
- Select All Servers from the Server list.
- Click the All HTTP Servers tab.
- Select your HTTP Server name in the table.
Example: JKLTEST
- Click Stop if the server is running.
- Click Start.
Logging will begin when the HTTP Server (powered by Apache) instance has
started. The JKL Web administrator has decided to use the IBM Tivoli--Web
site Analyzer  to generate usage reports. This product can read the log
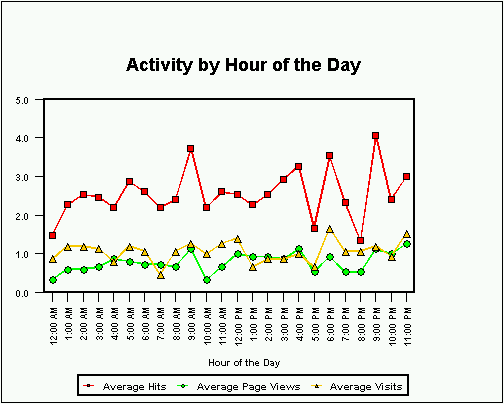
file and generate detailed reports that contain information such as the following:

Test your HTTP Server (powered by Apache)
- Open a new Web browser.
- Enter http://[iSeries_hostname]:[port] in the location or URL field.
Example: http://jkl_server:1975
Review your log for HTTP Server (powered by Apache) activity.
View your HTTP Server (powered by Apache) configuration
Your configuration will look similar if you used the given example in this and previous examples.
- Click the Manage tab.
- Click the HTTP Servers subtab.
- Select your HTTP Server (powered by Apache) from the Server list.
Example: JKLTEST
- Expand Tools.
- Click Display Configuration File.
Listen *:1975
DocumentRoot /www/jkltest/htdocs
ServerRoot /www/jkltest
Options -ExecCGI -FollowSymLinks -SymLinksIfOwnerMatch -Includes -IncludesNoExec -Indexes
LogFormat "%h %l %u %t \"%r\" %>s %b \"%{Referer}i\" \"%{User-Agent}i\"" combined
LogFormat "%{Cookie}n \"%r\" %t" cookie
LogFormat "%{User-agent}i" agent
LogFormat "%{Referer}i -> %U" referer
LogFormat "%h %l %u %t \"%r\" %>s %b" common
CustomLog logs/access_log combined
CustomLog logs/server_monitor combined
SetEnvIf "User-Agent" "Mozilla/2" nokeepalive
SetEnvIf "User-Agent" "JDK/1\.0" force-response-1.0
SetEnvIf "User-Agent" "Java/1\.0" force-response-1.0
SetEnvIf "User-Agent" "RealPlayer 4\.0" force-response-1.0
SetEnvIf "User-Agent" "MSIE 4\.0b2;" nokeepalive
SetEnvIf "User-Agent" "MSIE 4\.0b2;" force-response-1.0
<Directory />
	Order Deny,Allow
	Deny From all
</Directory>
<Directory /www/jkltest/htdocs>
	Order Allow,Deny
	Allow From all
</Directory>