Minimize the number of requests in WebSphere Application Server - Express queues.
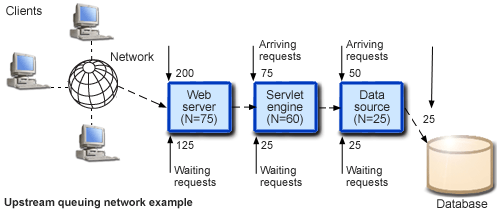
Performance is usually improved if requests wait in the network, ahead of the Web server, rather than waiting in the application server. That is, only requests that can be processed enter the queuing network. To achieve this result, set the size of upstream (closest to the client) queues large, and specify progressively smaller sizes for downstream (further from the client) queues. This figure provides an example of this configuration:

Queues in the queuing network become progressively smaller as work flows downstream. In this example, 200 client requests arrive at the Web server. 125 requests remain queued in the network because the Web server is set to handle 75 concurrent requests. As the 75 requests pass from the Web server to the Web container, 25 requests remain queued in the Web server and the remaining 50 are handled by the Web container. This process progresses through the data source until 25 user requests arrive at the final destination, the database server. Because there is work waiting to enter a component at each point upstream, no component in this system must wait for work to arrive. Most of the requests wait in the network, outside of WebSphere Application Server - Express. This type of configuration adds stability, because no component is overloaded.
Draw throughput curves to determine when the system capabilities are maximized.
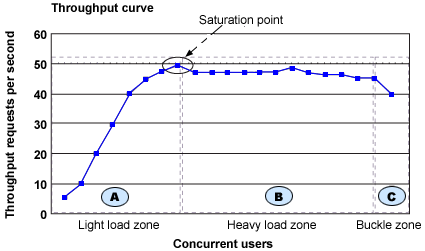
To run a test case that represents the full use of the production application, exercise all meaningful code paths or use the production application. Run a set of tests to determine when the system capabilities are fully stressed or when the network reaches the saturation point. Conduct these tests after most bottlenecks are removed from the application. The goal of these tests is to drive CPUs to near 100% utilization. For maximum concurrency through the system, start the initial baseline experiment with large queues. For example, start the first experiment with a queue size of 100 at each of the servers in the queuing network: Web server, Web container, and data source. Begin a series of experiments to plot a throughput curve, increasing the concurrent user load after each experiment. For example, perform experiments with 1, 2, 5, 10, 25, 50, 100, 150 and 200 users. After each test, record the throughput requests per second, and response times in seconds per request. The curve resulting from the baseline experiments resembles the following typical throughput curve:

WebSphere Application Server - Express throughput is a function of the number of concurrent requests present in the total system. Section A, the light load zone, shows that as the number of concurrent user requests increases, the throughput increases almost linearly with the number of requests. Under light loads, concurrent requests face very little congestion within the WebSphere Application Server - Express system queues. At some point, congestion starts to develop and throughput increases at a much lower rate until it reaches a saturation point that represents the maximum throughput value, as determined by some bottleneck in the WebSphere Application Server - Express system. The most manageable type of bottleneck occurs when the WebSphere Application Server - Express machine CPUs become fully utilized. To resolve this bottleneck, add processing power.
In the heavy load zone, Section B, as the concurrent client load increases, throughput remains relatively constant. However, the response time increases proportionally to the user load. That is, if the user load is doubled in the heavy load zone, the response time doubles. At some point, represented by Section C, the buckle zone, one of the system components becomes exhausted. At this point, throughput starts to decrease. For example, the system might enter the buckle zone when the network connections at the Web server exhaust the limits of the network adapter or if the requests exceed operating system limits for file handles.
If the saturation point is reached by driving CPU utilization close to 100%, you can move on to the next step. If the saturation point occurs before system utilization reaches 100%, another bottleneck is probably the cause. For example, the application might be creating Java objects and causing excessive garbage collection bottlenecks in the Java code.
There are two ways to manage application bottlenecks: remove the bottleneck or clone the bottleneck. The best way to manage a bottleneck is to remove it. You can use a Java-based application profiler to examine overall object utilization. For a list of available tools, see Performance tools.
Decrease queue sizes as requests move downstream from the client.
The number of concurrent users at the throughput saturation point represents the maximum concurrency of the application. For example, if the application saturates WebSphere Application Server - Express at 50 users, using 48 users might produce the best combination of throughput and response time. This value is called the Max Application Concurrency value. Max Application Concurrency becomes the preferred value for adjusting the WebSphere Application Server - Express system queues. Remember, it is desirable for most users to wait in the network; therefore, queue sizes should decrease when moving downstream farther from the client. For example, given a Max Application Concurrency value of 48, you might start with system queues at the following values: Web server 75, Web container 50, data source 45. Perform a set of additional tests with slightly higher and lower values to find the best settings.
Adjust queue settings to correspond to access patterns.
In many cases, only a fraction of the requests that pass through one queue enter the next queue downstream. For example, on a Web site with many static pages, a number of requests are fulfilled at the Web server and are not passed to the Web container. In this case, the Web server queue can be significantly larger than the Web container queue. In the previous example, the Web server queue was set to 75, rather than closer to the value of Max Application Concurrency. You can make similar adjustments when different components have different execution times.
For example, in an application that spends 90% of its time in a complex servlet and only 10% of its time making a short Java database connectivity (JDBC) query, on average 10% of the servlets are using database connections at any time, so the database connection queue can be significantly smaller than the Web container queue. Conversely, if the majority of servlet execution time is spent making a complex query to a database, consider increasing the queue values at both the Web container and the data source. Always monitor the CPU and memory utilization for both the WebSphere Application Server - Express and the database servers to verify that the CPU or memory are not overloaded.