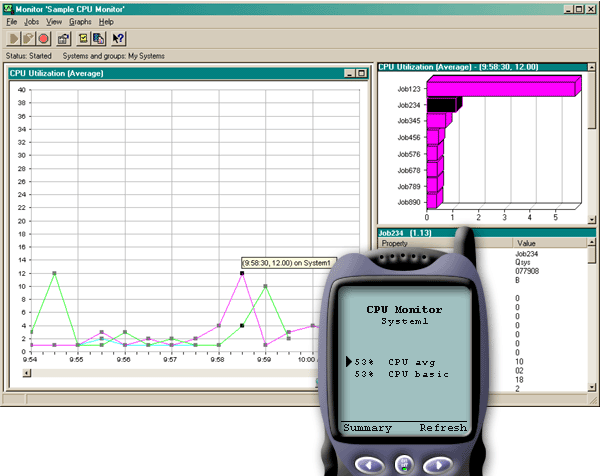
You can work with system monitors to view the metrics and current values being monitored, as well as the top 20 items (jobs, disk units, and so forth) that make up the metric value. You can also work with jobs listed in the monitor (display details, hold, release, and end).
Select the System monitors link to display a list of all your active system monitors (any monitors that are stopped are not shown). If any monitors failed or are triggered, an exclamation point or bell appears next to the monitor.
When you select a monitor, it shows all systems where that monitor is running, and if you select a system, it shows you all metrics in that monitor and the values for the selected system.
Once you see the metric you are interested in, you can select the metric and it shows you the top 20 items that caused that metric value. For example, if you select CPU average, it shows you the top 20 jobs. Or, if you select Disk utilization, it shows you the top 20 disk units.

From the list of jobs, you can also select a job to see details, and you can work with that job by selecting Hold, Release, or End.
You can refresh each page to refresh the list at any time. You can also select Home to display an updated summary page.
Because display size is minimal, the system monitor metric names are shortened. Here is a table that describes what iSeries™ Navigator for Wireless displays:
Monitor metric names in iSeries Navigator for Wireless:
| System monitor metric names | iSeries Navigator for Wireless name | Unit of measure |
|---|---|---|
| CPU Utilization (Average) | CPU avg | % busy |
| CPU Utilization (Interactive Jobs) | CPU int jobs | % busy |
| CPU Utilization (Interactive Feature) | CPU int feature | % |
| CPU Utilization Basic (Average) | CPU basic | % busy |
| CPU Utilization (Secondary Workloads) | CPU 2nd workload | % |
| CPU Utilization (Database Capability) | CPU DB | % |
| Interactive Response Time (Average) | Int resp avg | Seconds |
| Interactive Response Time (Maximum) | Int resp max | Seconds |
| Transaction Rate (Average) | Trans rate avg | Transactions per second |
| Transaction Rate (Interactive) | Trans rate int | Transactions per second |
| Batch Logical Database I/O | Batch DB IO | IO/second |
| Disk Arm Utilization (Average) | Disk util avg | % busy |
| Disk Arm Utilization (Maximum) | Disk util max | % busy |
| Disk Storage (Average) | Disk stg avg | % full |
| Disk Storage (Maximum) | Disk stg max | % full |
| Disk IOP Utilization (Average) | Disk IOP avg | % busy |
| Disk IOP Utilization (Maximum) | Disk IOP max | % busy |
| Communications IOP Utilization (Average) | Comm IOP avg | % busy |
| Communications IOP Utilization (Maximum) | Comm IOP max | % busy |
| Communications Line Utilization (Average) | Comm line avg | % busy |
| Communications Line Utilization (Maximum | Comm line max | % busy |
| LAN Utilization (Average) | LAN avg | % busy |
| LAN Utilization (Maximum) | LAN max | % busy |
| Machine Pool Faults | Mch pool fault | Faults per second |
| User Pool Faults (Average) | Usr pool fault avg | Faults per second |
| User Pool Faults (Maximum) | Usr pool fault max | Faults per second |