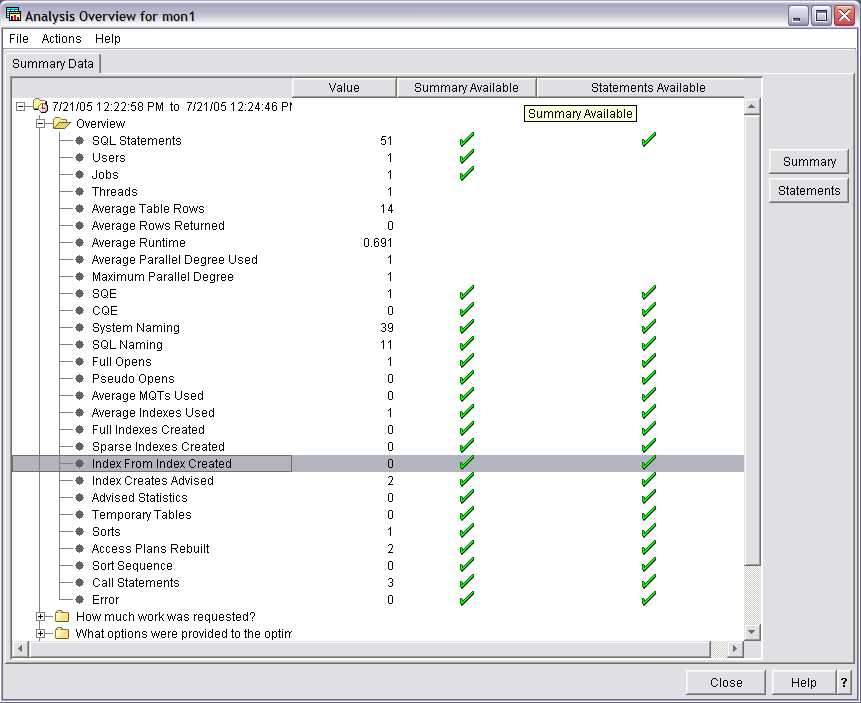
SQL Performance monitors provides several predefined reports that you can use to analyze your monitor data.
To view these reports, right-click a monitor and select Analyze. The monitor does not need to be ended in order to view this information.

On the Analysis Overview dialog, you can view overview information or else choose one of the following categories:
- How much work was requested?
- What options were provided to the optimizer?
- What implementations did the optimizer use?
- What types of SQL statements were requested?
- Miscellaneous information
- I/O information
From the Actions menu, you can choose one of the following summary predefined reports:
- User summary
- Contains a row of summary information for each user. Each row summarizes all SQL activity for that user.
- Job summary
- Contains a row of information for each job. Each row summarizes all SQL activity for that job. This information can be used to tell which jobs on the system are the heaviest users of SQL, and hence which ones are perhaps candidates for performance tuning. The user may then want to start a separate detailed performance monitor on an individual job to get more detailed information without having to monitor the entire system.
- Operation summary
- Contains a row of summary information for each type of SQL operation. Each row summarizes all SQL activity for that type of SQL operation. This information provides the user with a high level indication of the type of SQL statements used. For example, are the applications mainly read-only, or is there a large amount of update, delete, or insert activity. This information can then be used to try specific performance tuning techniques. For example, if a large amount of INSERT activity is occurring, perhaps using an OVRDBF command to increase the blocking factor or perhaps use of the QDBENCWT API is appropriate.
- Program summary
- Contains a row of information for each program that performed SQL operations. Each row summarizes all SQL activity for that program. This information can be used to identify which programs use the most or most expensive SQL statements. Those programs are then potential candidates for performance tuning. Note that a program name is only available if the SQL statements are embedded inside a compiled program. SQL statements that are issued through ODBC, JDBC, or OLE DB have a blank program name unless they result from a procedure, function, or trigger.
In addition, when a green check is displayed under Summary column, you can select that row and click Summary to view information about that row type. Click Help for more information about the summary report. To view information organized by statements, click Statements.